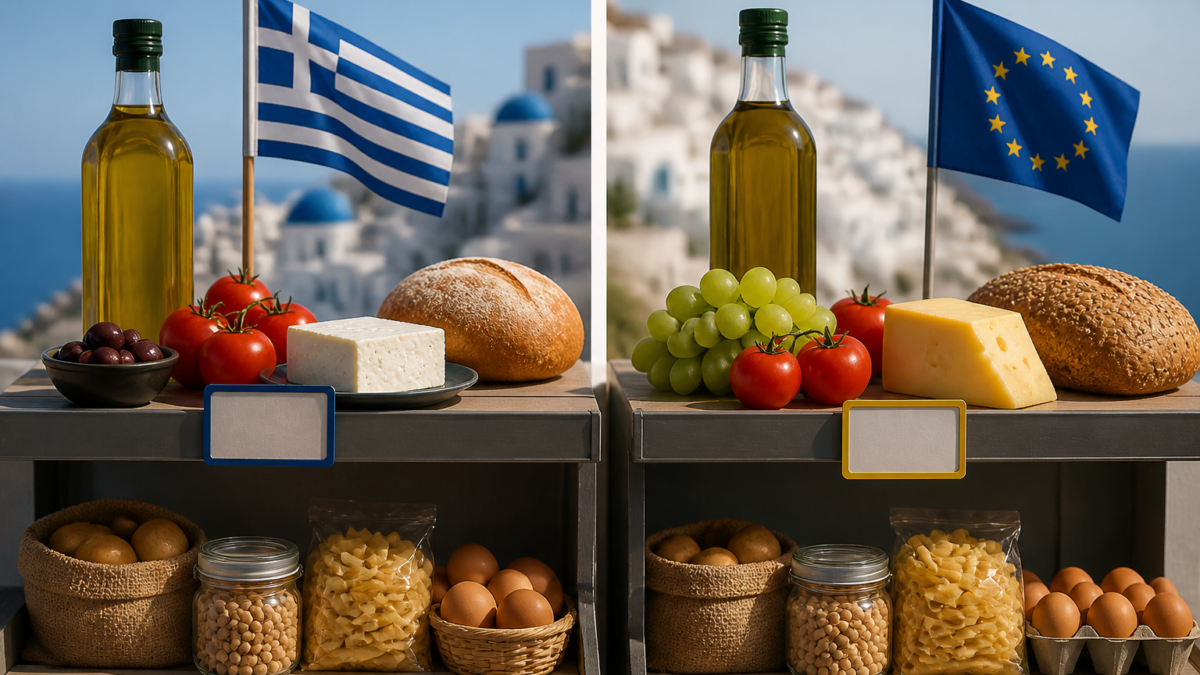
Ten products below and ten above the European average
Among the 20 product codes included in the comparison, prices in Greece are split exactly down the middle: half are lower than the corresponding European average and the other half are higher. The findings, therefore, do not point to a single picture in which all products cost more or less in our country.
The largest reported differences reach 47.5% below and 43% above the average. These figures describe the extremes of the comparison, not the picture for every product. However, the names of the specific product codes corresponding to the largest differences are not provided, nor are their prices.
The extreme differences do not, on their own, describe the whole picture
The fact that the differences range from significantly lower to noticeably higher prices shows that the result depends on the product being examined. Counting the cases—ten lower and ten higher—is not enough to conclude whether the overall price level in Greece is more or less favourable.
To make such an overall assessment, the size of each difference and the way the final result is calculated would need to be known. The figures presented do not give an average difference for the 20 product codes, nor do they clarify whether all categories carry the same weight. Therefore, the percentages at the two extremes should not be read as if they described the typical difference across all products.
What we know—and what is missing for a reliable comparison
The findings provide two clear facts: the number of products that are below or above the European average, and the range of the largest reported differences. However, they do not name the products, list the individual prices or specify which countries are included in the average. Without this information, it is not possible to verify what comparison underlies each percentage.
There is also no information about when the data were recorded or whether the prices refer to exactly the same packaging and product characteristics. These details would allow readers to better assess how representative each comparison is. Based on the information provided, the safe conclusion remains limited: for half of the products in this particular study, the Greek price is lower than the European average, while for the other half it is higher. The comparison alone does not establish a general ranking of Greece as cheaper or more expensive.
The Greek perspective
The comparison concerns prices in Greece against the European average.